Causeway: A message-oriented distributed debugger
Causeway is an open source distributed debugger for examining the behavior of distributed programs built as communicating event loops. It is the first distributed debugger to emphasize message order–the message flow in and out of different processes–rather than process order–the chain of events within each process.
Our message-oriented approach borrows an effective strategy from sequential debugging: To find the source of unintended side-effects, start with the chain of expressed intentions. For most of us, the stack view and examining the call stack is central to debugging sequential programs. By emphasizing message order Causeway supports the distributed equivalent of the call stack.
A bit of history…
The communicating event loops computational model requires particular support not provided by conventional distributed debuggers. We started a research project to build a debugger to support what was at the time, a niche market. Our customers for the first release in 2005 were computer science graduate students writing promise-based distributed programs in the E language.
Building on this, we extended Causeway to support the event loops model, in general. Two platforms were instrumented to generate Causeway's language-neutral trace log format. This effort gave us experience with new languages (Java, AmbientTalk) and different promise architectures (Waterken ref-send, AmbientTalk Futures).
Our niche market is growing…
With the emergence of the web as an application platform, communicating event loops are rapidly becoming the mainstream model for distributed computation. The web browser runs multiple isolated JavaScript programs. Each program runs as an event loop, processing user interface events as well as asynchronous messages from a server. With HTML5, JavaScript event loops within the browser will be able to send asynchronous messages to each other and to multiple servers.
Causeway running in the browser…
Summer 2011 we began our effort to port Causeway to the web. It was a good summer: Causeway, rewritten in JavaScript and HTML5 Canvas, now runs in the browser and presents two graphical, interactive visualizations of program behavior. The open source project is at Google Project Hosting. Our project home page has links to live versions of the examples described here.
The example programs described here are simple JavaScript programs, generating small trace logs. They are interesting in that they communicate asynchronously to workers and iframes through the postMessage() API. A principal motivation behind Causeway is to support following message flow across machine and process boundaries. Focusing on distributed computation internal to the browser and these simple test cases gave a good place to start.
And more to come…
Upcoming web standards will support a more distributed interconnected web. Browsers will communicate with multiple servers (cross-origin XHR2, server-sent events, websockets); servers will communicate directly to provide web services. Soon mainstream web developers will be building large distributed system.
Over the near-term we expect to improve causality tracing in the browser. Longer term we expect to proceed to larger, more complex test cases. Also, to better support web developers we would like to investigate the possibility of integrating Causeway with browser developer tools.
Causeway, in the small…
The following example programs demonstrate Causeway's support for distributed computation internal to the browser.
Causality Grid
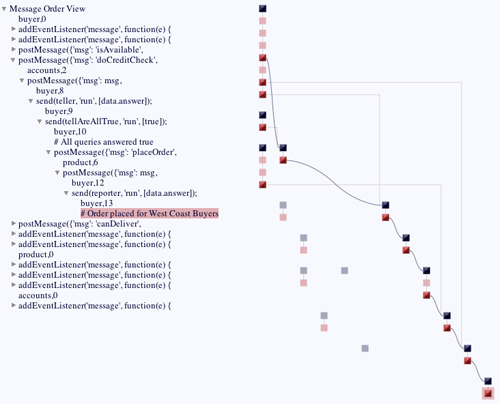
The causality grid visualization shows the happened-before relation. Each black box represents the top-of-turn event, i.e., the receive event that starts a new turn. Vertically-connected red boxes represent events that occurred during that turn. Arcs are message sends.
The grid layout algorithm is constrained by the communicating event loops execution model. It constructs a causal order as described by the log records. The trace log format encodes the process order and message order of a distributed set of events. Log records can include timestamps but they are not required. Without a global clock the precise ordering of events cannot be known but these partial orders are sufficient for describing the happened-before relation.
Selecting an event on the grid highlights all events connected to it in message order. The corresponding text (source code, if available) is automatically selected in the message-order outline.
Consider tracking down a bug that manifests at the selected event. The question to answer is What likely caused this to happen? Message order describes the most likely causes, the events to examine first. This is analogous to examining the call stack in conventional sequential programming. If message order does not reveal the bug, potential causality–the happened-before relation–must be considered.
The JavaScript program being debugged runs in the browser and communicates with web workers through the asynchronous postMessage() API. The main page loop, buyer, queries two remote workers, product and accounts. The answers from the asynchronous queries must be collected and examined to verify that all requirements are satisfied before placing an order.
Causeway presents the distributed program as message flow between communicating event loops, in this case, the messaging from main page to workers and back again.
The selected event is a comment event logging that the order was placed. The grid shows the selection (rightmost, bottom) and highlights the events most likely to have influenced the state at the selection. Start here to track down a bug. Worst case is examining full happened before. On the causality grid, this includes all events left and above the selection, in this case: all events.
Some events have multiple causes. For example, buyer sends doCreditCheck to accounts but the message is received only if accounts is listening. The receive event has two causes: the message send by buyer and the earlier posting of an event handler by accounts.

Sourcilloscope
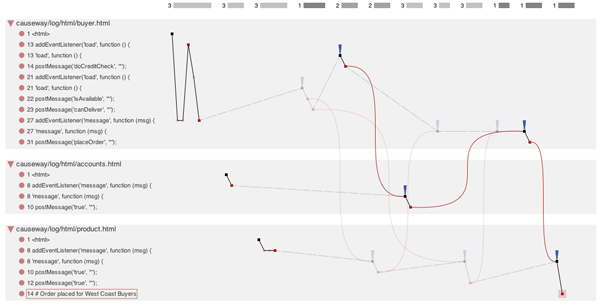
The sourcilloscope visualization orients the events by their corresponding source code, a very familiar context for the developer. (The name is a play on oscilloscope from electrical engineering.) The text outline view includes a top-level item for each source file referenced in the trace log; nested items are the individual source lines referenced by the top of call stack in each log record. This visualization is expressive and highly interactive.
At a glance: You can see all events with the same top of stack, the number of communicating event loops, a visual indication of potential parallelism, the posting of an event handler and the firing of an event. As with the grid, you can track process order and message order.
With a click: You can filter out source files or individual source lines. As with the grid, selecting an event on the scope highlights all causally-connected events in message order and shows the corresponding line of source code.
This expressive, elegant layout was designed and implemented by Alexy Agranovsky (UC Davis, while at Google) and Tyler Close (Google).
The JavaScript program being debugged has the same functionality as the grid example but the asynchronous communication is between iframes on the web page.
Notice that the same comment event is selected (rightmost, bottom event) and message order is highlighted.

Causeway, in the large… Griddle
The two examples above are very small. Our limited experience with large distributed systems generating voluminous trace logs introduced us to a myriad of challenges. There's an overwhelming amount of information, most of which is uninteresting. In the large, event filtering and abstraction are critical. Early filtering reduces volume; interactive filtering hides detail that is at the moment, uninteresting or distracting. But it's not a simple matter of turning a knob for more or less information. The best way to find the interesting causality and present it at the right level of abstraction is through user interaction. To continue making progress in this area, we need more experience with real-world systems. We are looking for test cases to stress our filtering algorithms and visualizations.
We are intrigued by the possibility that the abstract, highly-expressive visualizations can show the shape of the execution and meaningful patterns can be learned over time. At a glance, a display updating with streaming events, can indicate whether things are cooking along as expected, or not. An unexpected pattern can signal a problem.
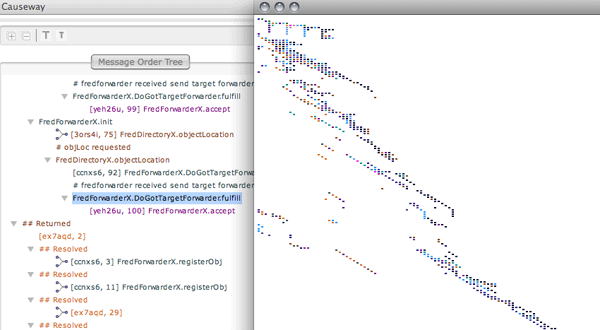
This partial screenshot shows the rendering of an experiental trace log capture at HP Labs. The promise-based program was distributed across 30 processes. In this visualization, events in the same grid column indicate potential parallelism.

What Causeway doesn't do…
So, you've seen what Causeway can do; you should be aware of what it doesn't do.
- Causeway does not display data state. We do not capture data during logging. We log and display distributed control flow.
- Causeway is not primarily a visualization tool, although it can help explain program behavior.
- Causeway is not a performance analysis tool. We added (optional) timestamps to the log records but have always thought of these as good-enough timestamps that help identify performance outliers and liveness bugs.
Causeway is a distributed debugger used to understand program behavior for correctness, primarily during development and testing. The cognitive effort of debugging includes mapping observed behavior to a mental model of the original intentions, to discover misconceptions as well as semantic and logic errors. Watching program execution at an appropriate level of detail and without interruption, supports this effort. Our development tools support this well in the case of sequential single-thread computation. Our primary objective is to make a significant contribution to improving debugging support for the increasing number of developers writing asynchronous distributed applications.
